Outcomes, with the work behind them.

Each case below shows what was wrong, the approach taken, what was built and the measurable result. Client names are withheld where confidentiality applies.

Free, 30 minutes, no obligation. I only need view access to look at your account.

Documented portfolio totals

Numbers across the portfolio.

$508K

Media managed

887M

Impressions delivered

5.8M

Clicks generated

58K

Installs, registrations and leads

1,000+

Campaigns managed

Selected historical work documented in Prakhar Kirsali’s 2026 portfolio. Results span different clients, channels and reporting periods; past performance is not a guarantee.

Case studies

Five accounts: what was wrong, what changed.

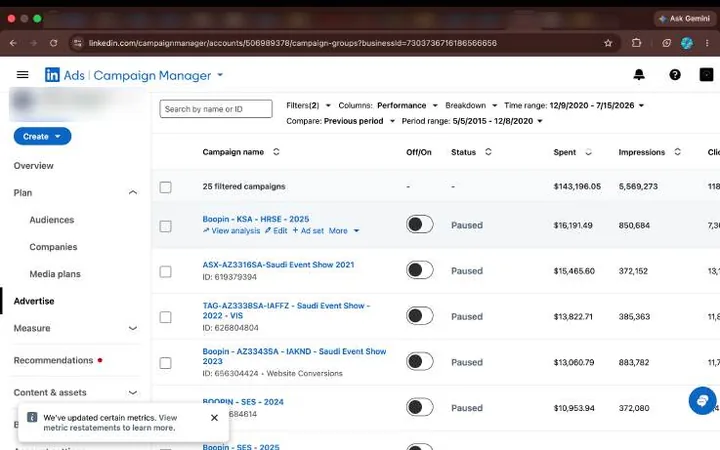
CASE 01 · GCC events — LinkedIn Ads

−74%

cost per lead

118K

clicks

2.13%

CTR

$143K

media managed

Client name withheld; market and channel shown.

Challenge
Lead costs were climbing and the sales team could not tell which campaigns produced real pipeline.
Approach
Rebuild the audience structure around buying intent, separate prospecting from retargeting, and tie every lead back to CRM outcomes before spending more.
Work
LinkedIn Ads restructure with audience layering, Insight Tag and lead-event validation, and a CRM-side review of lead quality by campaign.
Result
74% lower cost per lead on the flagship InMail campaign, within $143K of managed LinkedIn media.
Evidence
Account screenshots are shown further down. Read the full case study →
CASE 02 · Event marketing — Meta Ads

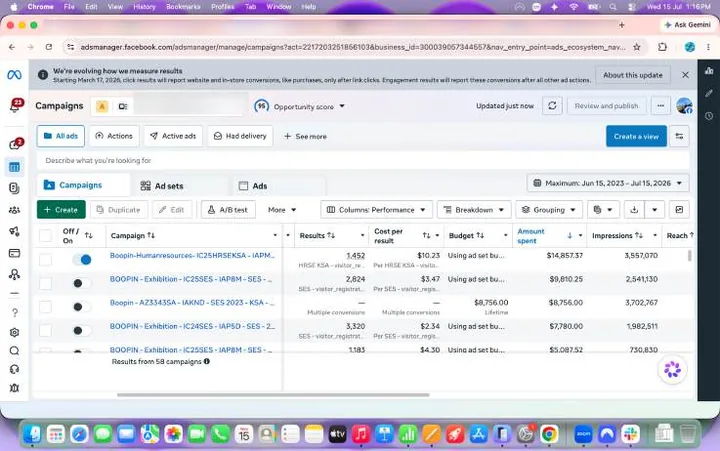
$4.28

average registration cost

$3.26

best 30-day result

Client name withheld; market and channel shown.

Challenge
Recurring event cycles needed high registration volume without cost per lead drifting upward each round.
Approach
Treat creative as the main lever, keep a steady testing cadence, and make sure registrations were recorded reliably on both browser and server.
Work
Meta Ads creative testing at campaign scale, Pixel and Conversions API event coverage, registration validation before scaling budget.
Result
$4.28 average cost per registration across four featured campaigns, with a $3.26 best 30-day result inside a 520-campaign account.
Evidence
Account screenshots are shown further down. Read the full case study →
CASE 03 · Fintech app — multi-platform acquisition

47,342

installs in 30 days

$0.58

lowest cost per install

163M

top-five campaign impressions

Client name withheld; market and channel shown.

Challenge
Install volume was needed at a low cost, but in-app events were unreliable so nobody trusted the reported numbers.
Approach
Fix the event layer first, then scale spend only on the sources producing verified installs and activations.
Work
Multi-platform paid acquisition with Firebase and GA4 event instrumentation and install attribution rebuilt from scratch.
Result
47,342 installs during the 15 June–14 July 2026 flight, with a lowest campaign CPI of $0.58 and 163M impressions across the top five campaigns.
Evidence
Account screenshots are shown further down. Read the full case study →
CASE 04 · Multi-account advertiser — Google Ads

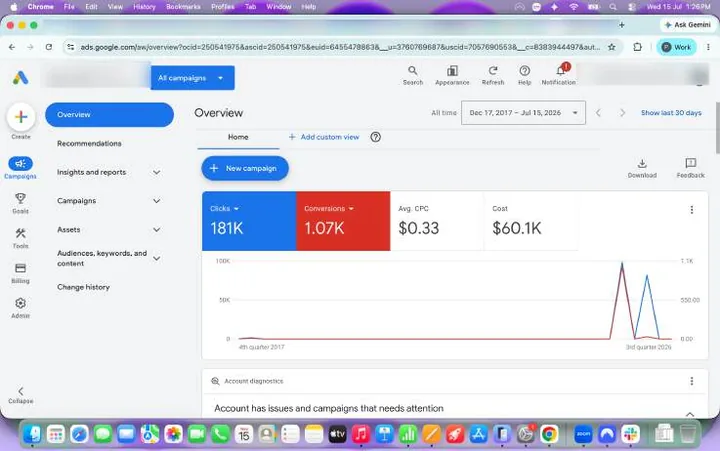
1.07K

conversions

181K

clicks

$0.33

average CPC

Client name withheld; market and channel shown.

Challenge
Several accounts ran in parallel with duplicated conversions and no shared view of pacing or performance.
Approach
Consolidate account structure, rebuild conversion tracking so bidding had clean inputs, then reallocate budget to what converted.
Work
Google Ads search restructure, conversion tracking rebuild, enhanced conversions and unified pacing across accounts.
Result
1.07K conversions from 181K clicks at $0.33 average CPC.
Evidence
Account screenshots are shown further down. Read the full case study →
CASE 05 · Cross-channel measurement rebuild

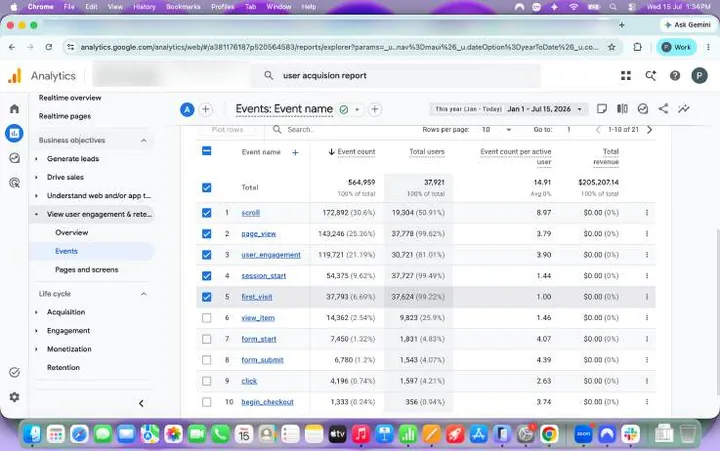
$205K

attributed revenue

565K

events tracked

Client name withheld; market and channel shown.

Challenge
Reporting disagreed with the ad platforms, so budget decisions were being made on numbers nobody trusted.
Approach
Define one event taxonomy, implement it consistently, and QA every event before it was used for reporting or bidding.
Work
GA4, Google Tag Manager and Firebase implementation with event taxonomy, validation and attribution reporting.
Result
564,959 events measured and $205,207 of revenue attributed back to source from 1 January–15 July 2026.
Evidence
Account screenshots are shown further down. Read the full case study →
Proof from live platforms

LinkedIn Campaign Manager showing 25 B2B campaigns and managed spend
LinkedIn Ads · $143K managed spend · 118K clicks · 2.13% CTR
Meta Ads Manager showing campaign registrations, cost per result and spend
Meta Ads · Registration campaigns with cost-per-result reporting
Google Ads account overview showing clicks, conversions, average CPC and spend
Google Ads · Managed MCC account · 181K clicks · 1.07K conversions · $0.33 CPC
Google Analytics event report showing event count and attributed revenue
GA4 Measurement · Jan–Jul 2026 · 564,959 events · $205,207 attributed revenue
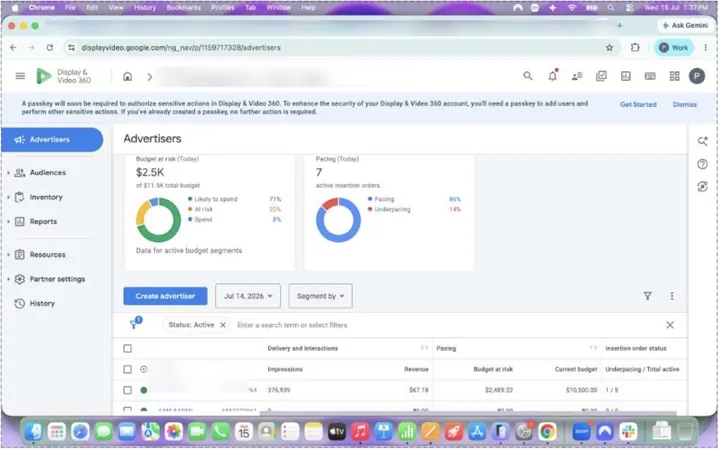
Display and Video 360 advertiser dashboard showing budget pacing and delivery operations
Display & Video 360 · Programmatic delivery · budget pacing · advertiser operations

Screenshots are from my 2026 portfolio. Sensitive account details are blurred where needed.

Read each project in depth — objective, measurement setup, changes, results and limitations — in the full case studies.

These results come from Google Ads management, Meta Ads management and LinkedIn Ads management, supported by conversion tracking and GA4 setup and analytics. They are paid media outcomes; they are not presented as evidence for managed SEO or marketing automation.

Selected historical campaign and measurement results. Past performance does not guarantee future results.

Get a straight answer on your ads, calls and website.

Book a free 30-minute call with me. I will look at your ads, tracking and website with you and tell you what I would fix first. No sales team, no obligation.